

Relational Clocks: I, You, We (2018)
Custom natural language processing software and data visualization, flat screen monitors, duration approx. 5 years
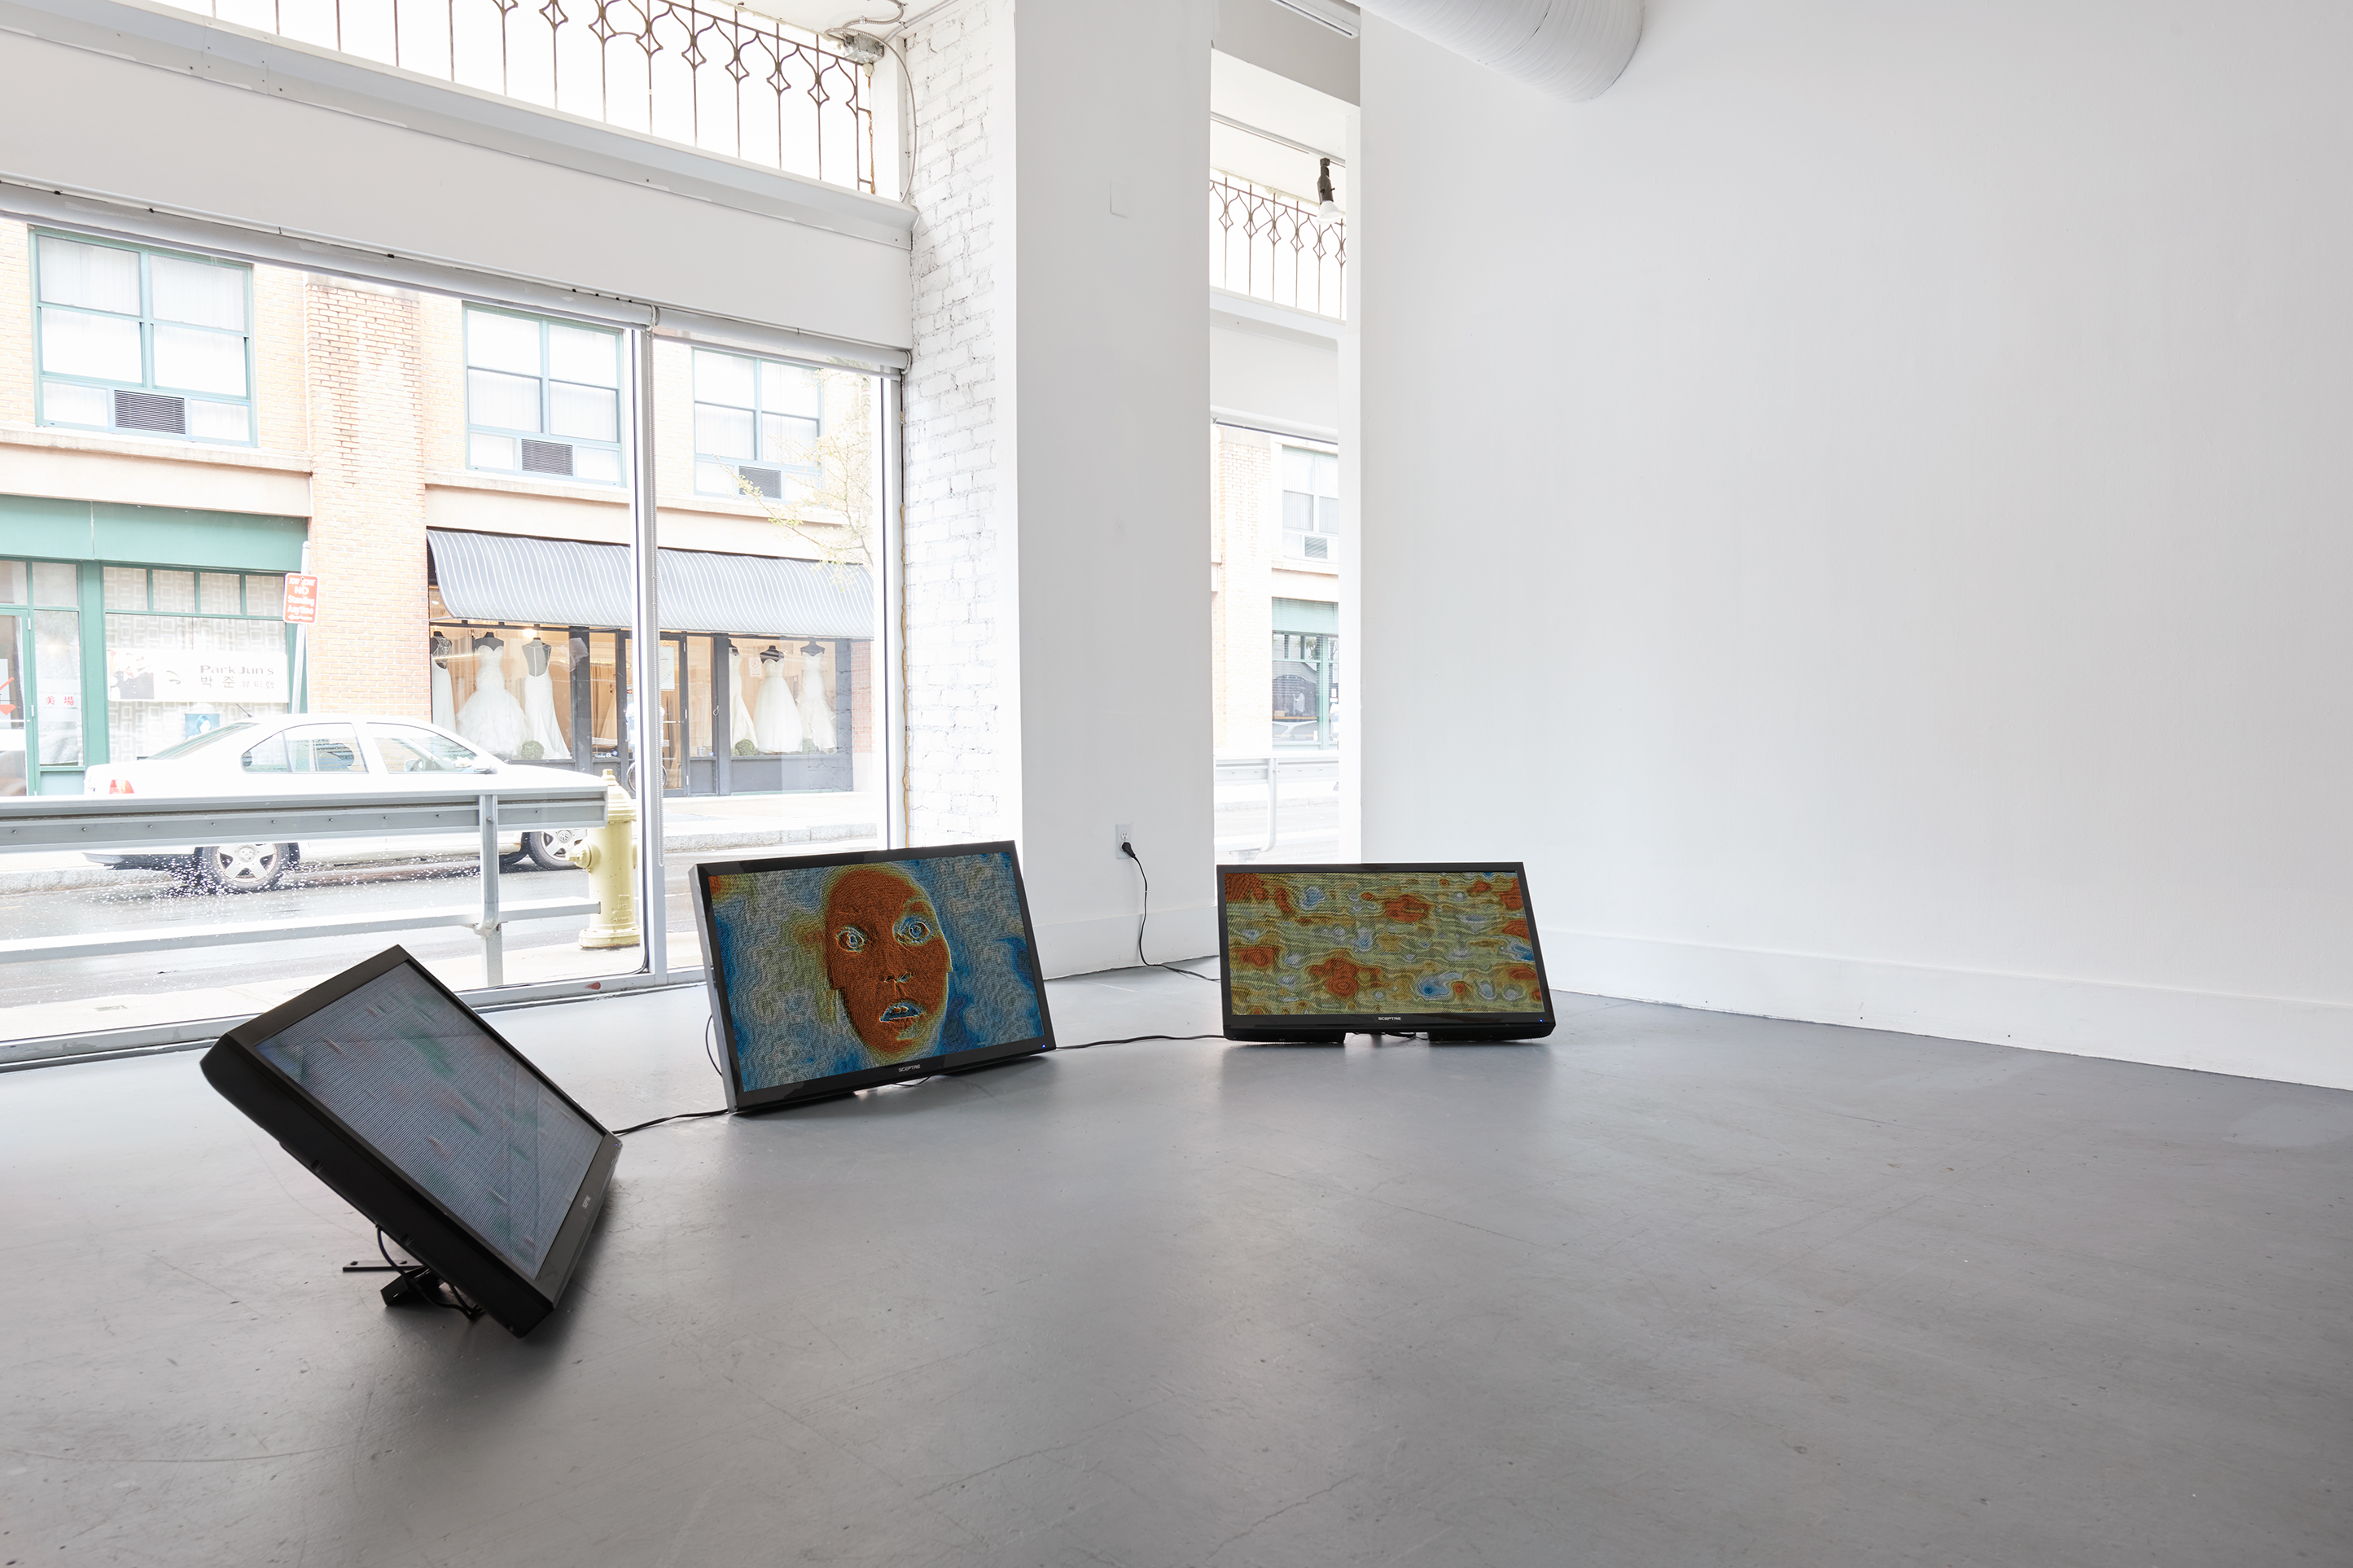
The "live" version of this piece uses custom software to read the emotional changes in this constant stream of emails to create a data visualization, beginning with the first email sent by the internet stalker on December 5, 2014. The visualization on each monitor corresponds to the usage of a pronoun in this email archive. The monitor on the left tracks “I,” the monitor on the right tracks “you,” and the monitor in the center tracks “we.”
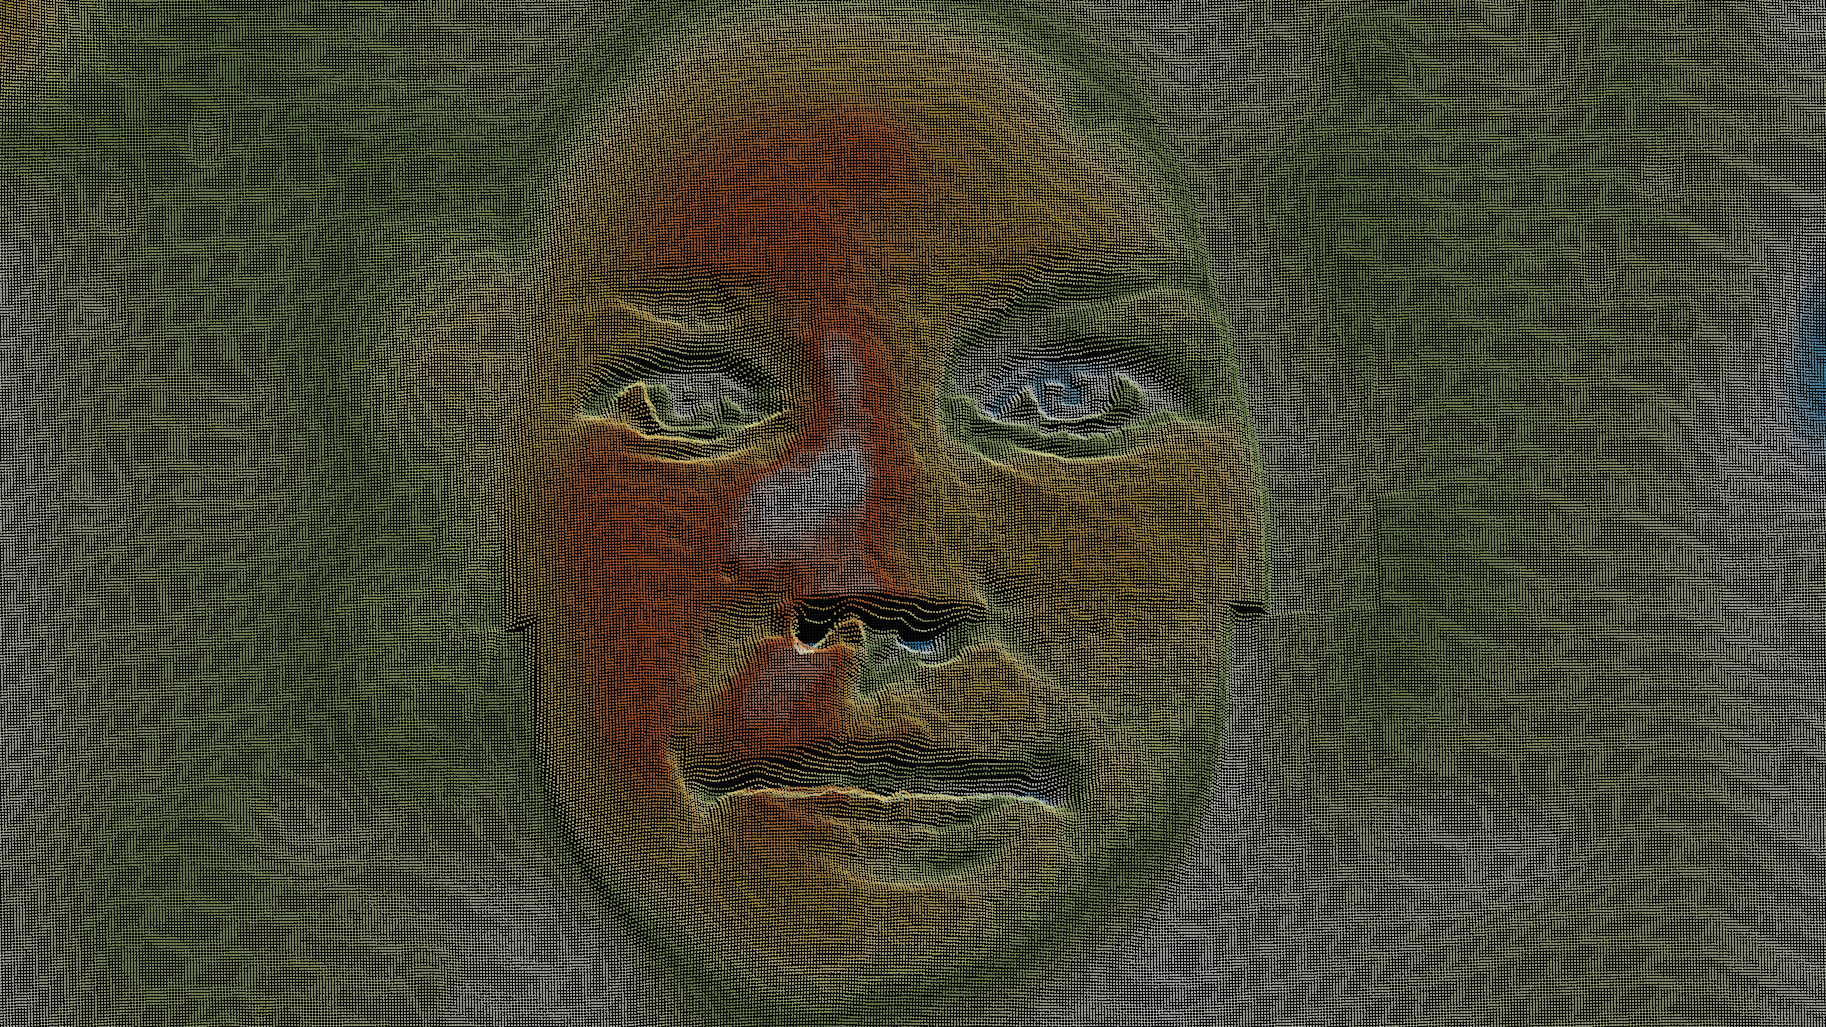
The software “reads” these emails at 100 words per minute, producing FACS expressions that illustrate the emotional context in which each pronoun is used. In between the facial expressions, each monitor shows a map of the emotional intensity of the pronouns used so far and their relative placement in a sentence, with the top left corner corresponding to the first word of a sentence and bottom right the last. The visualizations use the color scheme of a traditional topographical map: the protruding red forms represent growing angry or negative emotion, the blue receding forms represent calm or positive emotion. These clocks—which register change in emotion as well as time—will run as long as emails continue to be received.